REP - Reporting
REP is an optional itmSUITE® module that defines functionality to manage and excute reports created by Eclipse BIRT Designer tool.
It allows to load one or more report templates (BIRT.rptdesign file) and to create and to execute report instances through the BIRT Viewer integrated on itmSUITE®.
BIRT Architecture
BIRT (Business Intelligence Reporting Tool)is an open source tool installed as Eclipse IDE plug-in for report developing. It has origin from collaboration between Actuate (along with IBM) and Eclipse.org open source community.
BIRT is a Java based tool that allows to extract data from many data source types for report generation in several output format (pdf, xlsx, docx, etc.).
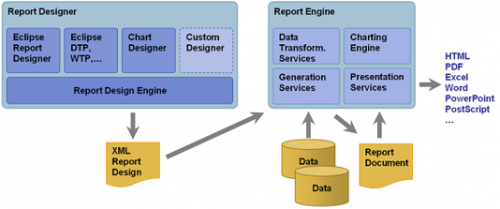
BIRT architecture includes two main components:
- Report Designer: a UI component to create report template (.rptdesign file)
- Report Engine: runtime component for report rendering
The Design Engine generates a .rptdesign file(in XML format) structured according to configurations applied by user (by BIRT Designer) and the Report Engine, through BIRT Viewer, parses it and renders it as report in html (or other formats).
BIRT Designer
BIRT Designer is a tool (plug-in) integrated to the Eclipse IDE that defines a user friendly interface to create BIRT report. It can be enabled from toolbar on Windows > Open Perspective > Report Design. BIRT Designer is composed of several Eclipse views to create/configure a report:
| View | Meaning |
|---|---|
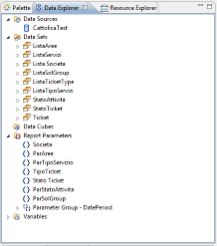
| Data Explorer | Allows the data management extracted from a specific data source (i.e. database, xlsx file, cvs file, etc.) in order to define data sets and parameters report |
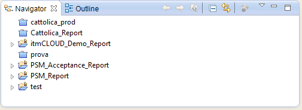
| Navigator | A projects management view. Every project contains one or more report template. |
| Layout | Main editor in which user can drag/drops and manages report items to define output report layout |
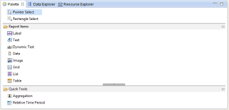
| Palette | Contains all graphic report items (label, table, chart, etc...) to add to report layout |
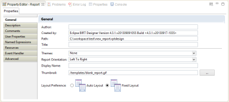
| Property Editor | Menu from which user can configure report items properties |
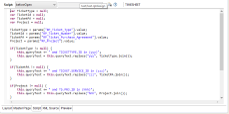
| Scripting Editor | Editor available for each report items in which insert event drivern JavaScript/Java code |
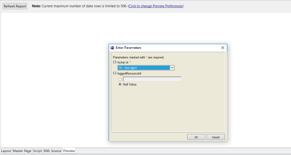
| Report Preview | View on which launch a report preview with a limited extracted data |
Birt Report Creation
A report can be outlined in a bottom-up 4-levels structure:
- Data: data extracted from data source (database, raw file, cvs, etc...)
- User Data: extracted data modified by user (e.g., data type changing)
- Business Logic: data elaborated according to event driven script (JavaScript/Java code)
- Prensentation: data bound to report items (tables, charts, etc...) and shown on report layout
In BIRT Designer all reports can be created as list, charts, crosstab, textual document or as combination of these items.
